Reprojection and tiling#
The equi7grid package offers utility functions to efficiently reproject geospatial imagery to the Equi7Grid. This process also includes slicing (i.e. “tiling”) the reprojected image into smaller chunks represented by Equi7Grid tiles.
The reprojection and tiling can be triggered using the resample_to_equi7_tiles function available in equi7grid’s warp module. resample_to_equi7_tiles has an extensive number of arguments described here. Three arguments are mandatory:
the file path to the input image (e.g., GeoTIFF, NetCDF)
an
Equi7Gridinstance defining the available tiling levels and continentsthe path to the output directory
There are a few optional arguments to highlight:
xy_bbox_map(bounding box in the Equi7Grid),geog_bbox(bounding box in the geographic projection), androi_geom(any polygon geometry): define a spatial subset for resampling (the input image will be resampled to all tiles intersecting with the region of interest).accurate_boundary: if the content of the image/raster is not axis parallel (the content is distorted and surrounded by no data values), this flag considers the accurate boundary of the raster content by discarding no data values. If it is set to false, then the image extent will be used.tile_*: these options define GeoTIFF image properties of the resampled, tiled file.
Note
equi7grid’s warp module requires additional depencies, which are not installed by default. You can install them via uv pip install equi7grid[warp].
To demonstrate how the resampling works, let’s create an exemplary GeoTIFF file. With the following function we write a GeoTIFF file using rasterio. The data is given in the webmercator projection, sampled with a 10km pixel size, and contains some classified values as UInt8.
import tempfile
from pathlib import Path

import numpy as np
import pyproj
import rasterio as rio
from rasterio.transform import from_bounds

tmp_dirpath = Path(tempfile.mkdtemp())
sample_filepath = tmp_dirpath / "webmercator_img_discrete.tif"
extent = (4_900_000, 7_810_000, 6_180_000, 8_750_000)
sampling = 10_000
nodata = 255
dtype = "uint8"
compress = "zstd"
sample_crs = pyproj.CRS.from_epsg(3857)

width, height = (
    int((extent[2] - extent[0]) / sampling),
    int((extent[3] - extent[1]) / sampling),
)
w_ar, h_ar = np.meshgrid(np.arange(width), np.arange(height))
ar = w_ar**2 + h_ar**2
ar[ar < (width + height)] = 0
ar[(ar >= (width + height)) & (ar < (width**2 + height))] = 1
ar[ar >= (width**2 + height)] = 2

transform = from_bounds(*extent, width, height)
kwargs = {}
kwargs.update(
    {
        "crs": sample_crs,
        "transform": transform,
        "width": width,
        "height": height,
        "nodata": nodata,
        "dtype": dtype,
        "compress": compress,
        "count": 1,
    }
)

with rio.open(sample_filepath, "w", **kwargs) as rd:
    rd.write(ar.astype(np.uint8), 1)
After generating the data, we can generate a small helper function to inspect the data using cartopy:
from collections.abc import Sequence
from typing import cast

import matplotlib.pyplot as plt
from cartopy.mpl.geoaxes import GeoAxes
from pytileproj.projgeom import pyproj_to_cartopy_crs

extent_bfr = 3_000_000


def plot_img(filepath: Path, tiff_extent: Sequence[float], ax: GeoAxes) -> None:
    """Load masked image data and plot it on a map."""
    img = plt.imread(filepath)
    img_extent = [tiff_extent[0], tiff_extent[2], tiff_extent[1], tiff_extent[3]]
    img_ma = np.ma.array(img, fill_value=nodata, mask=img == nodata)
    ax.imshow(img_ma, extent=img_extent, origin="upper", cmap="Paired", vmin=0, vmax=2)


map_crs = pyproj_to_cartopy_crs(sample_crs)
fig = plt.figure()
ax = cast("GeoAxes", fig.add_subplot(1, 1, 1, projection=map_crs))
ax.coastlines()
map_extent = [
    extent[0] - extent_bfr,
    extent[2] + extent_bfr,
    extent[1] - extent_bfr,
    extent[3] + extent_bfr,
]
ax.set_extent(map_extent, crs=map_crs)
plot_img(sample_filepath, extent, ax)
plt.show()
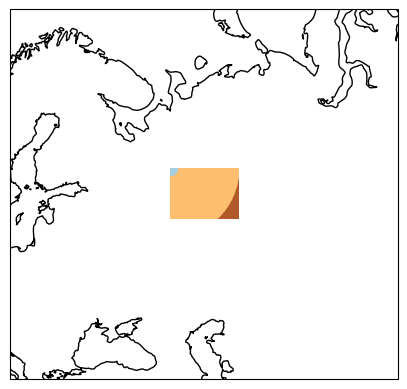
Now, we create our Equi7Grid object, which defines the target projection and tiling scheme. The image above depicts already a special case, since it overlaps the “EU” and “AS” continental boundary of the Equi7Grid. This means that – by default – the image will be reprojected to both continental projections. In the following, we only want to work with data in the “EU” system, which can be defined with the continent_order argument. Furthermore, we want to oversample the data to finer grid with 3km, and work with “T6” tiles.
from equi7grid import Equi7Grid, get_standard_equi7grid

e7grid = get_standard_equi7grid({"T6": 3_000}, continent_order=["EU"])
Note, that continent_order=["EU"] sets that only output for Europe is generated, and the other six continents are dropped.
Finally – to actually create the regridded images – we create the output directory, set all desired arguments, and execute resample_to_equi7_tiles:
from equi7grid.warp import resample_to_equi7_tiles

out_dirpath = Path(tempfile.mkdtemp())
tile_filepaths = resample_to_equi7_tiles(
    sample_filepath,
    e7grid,
    out_dirpath,
    tiling_id="T6",
    accurate_boundary=True,
    compress_type="zstd",
)
tile_filepaths
[PosixPath('/tmp/tmpcgpsadf1/EQUI7_EU/E066N024T6/webmercator_img_discrete_EU_E066N024T6.tif'),
 PosixPath('/tmp/tmpcgpsadf1/EQUI7_EU/E066N030T6/webmercator_img_discrete_EU_E066N030T6.tif'),
 PosixPath('/tmp/tmpcgpsadf1/EQUI7_EU/E072N024T6/webmercator_img_discrete_EU_E072N024T6.tif'),
 PosixPath('/tmp/tmpcgpsadf1/EQUI7_EU/E072N030T6/webmercator_img_discrete_EU_E072N030T6.tif')]
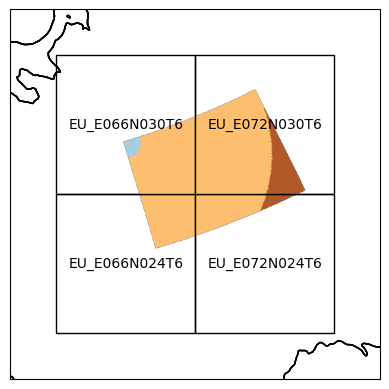
The input image has been sliced into four tiles in the “EU” Equi7Grid projection. Lets take a look at the resampled data:
extent_bfr = 200_000


def plt_e7_tiled_data(
    tile_filepaths: list[str], e7grid: Equi7Grid, continent: str
) -> None:
    """Plot tiled image data located in the Equi7Grid."""
    map_crs = pyproj_to_cartopy_crs(e7grid[continent].pyproj_crs)
    fig = plt.figure()
    ax = cast("GeoAxes", fig.add_subplot(1, 1, 1, projection=map_crs))
    ax.coastlines()
    min_x = 1e12
    max_x = 0
    min_y = 1e12
    max_y = 0
    for tile_filepath in tile_filepaths:
        tilename = tile_filepath.stem[-13:]
        tile = e7grid.get_tile_from_name(tilename)
        plot_img(Path(tile_filepath), tile.outer_boundary_extent, ax)
        min_x = min(min_x, tile.ll_x)
        min_y = min(min_y, tile.ll_y)
        max_x = max(max_x, tile.ur_x)
        max_y = max(max_y, tile.ur_y)
        tile.plot(ax=ax, label_tile=True, facecolor="None")
    map_extent = [
        min_x - extent_bfr,
        max_x + extent_bfr,
        min_y - extent_bfr,
        max_y + extent_bfr,
    ]
    ax.set_extent(map_extent, crs=map_crs)
    plt.show()


plt_e7_tiled_data(tile_filepaths, e7grid, "EU")
Specify tiles#
If we are only interested in (a) specific tile(s), we can specify them as an argument:
e7grid = get_standard_equi7grid({"T6": 3_000})
tile_filepaths = resample_to_equi7_tiles(
    sample_filepath,
    e7grid,
    out_dirpath,
    tiling_id="T6",
    accurate_boundary=True,
    compress_type="zstd",
    ftilenames=["AS_E012N066T6", "AS_E018N066T6"],
)
tile_filepaths
[PosixPath('/tmp/tmpcgpsadf1/EQUI7_AS/E012N066T6/webmercator_img_discrete_AS_E012N066T6.tif'),
 PosixPath('/tmp/tmpcgpsadf1/EQUI7_AS/E018N066T6/webmercator_img_discrete_AS_E018N066T6.tif')]
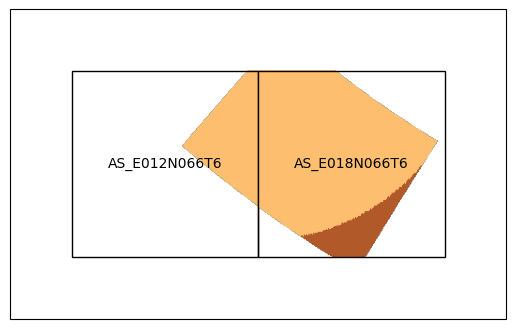
plt_e7_tiled_data(tile_filepaths, e7grid, "AS")
Specify naming convention#
If you want to change the standard naming: [filename]_[full tilename].[suffix] to something else, you can create your own naming convention. To do so, you need to define a function with the filepath of the input image and the full tilename as arguments.
def my_naming_convention(filepath: Path, ftilename: str) -> str:
    """Define own naming convention."""
    return f"{ftilename}_for_my_new_file{filepath.suffix}"


tile_filepaths = resample_to_equi7_tiles(
    sample_filepath,
    e7grid,
    out_dirpath,
    tiling_id="T6",
    accurate_boundary=True,
    compress_type="zstd",
    naming_traffo=my_naming_convention,
)
tile_filepaths
[PosixPath('/tmp/tmpcgpsadf1/EQUI7_AS/E018N060T6/AS_E018N060T6_for_my_new_file.tif'),
 PosixPath('/tmp/tmpcgpsadf1/EQUI7_AS/E018N066T6/AS_E018N066T6_for_my_new_file.tif'),
 PosixPath('/tmp/tmpcgpsadf1/EQUI7_EU/E066N024T6/EU_E066N024T6_for_my_new_file.tif'),
 PosixPath('/tmp/tmpcgpsadf1/EQUI7_EU/E066N030T6/EU_E066N030T6_for_my_new_file.tif'),
 PosixPath('/tmp/tmpcgpsadf1/EQUI7_EU/E072N024T6/EU_E072N024T6_for_my_new_file.tif'),
 PosixPath('/tmp/tmpcgpsadf1/EQUI7_EU/E072N030T6/EU_E072N030T6_for_my_new_file.tif')]