Tile#
A tile is a rectangular area defined by four Equi7Grid coordinates and is the smallest unit in the Equi7Grid system. A tile belongs to a specific Equi7Grid tiling scheme to subdivide the large projection extent.
In the equi7grid package such a tile is realised via the Equi7Tile class. Its implementation extends the definition of pytileproj’s RasterTile class. A user does not need to know how to initialise an Equi7Tile object, since this is done internally and only Equi7Tile instances are provided via tiling system and grid methods. The next sections provide more details on how to use an Equi7Tile instance.
First, lets assume we performed a tile query on an Equi7Grid instance and we retrieved a single Equi7Tile object:
from equi7grid import get_standard_equi7grid

e7grid = get_standard_equi7grid({"T6": 500})
e7tile = e7grid.EU.get_tile_from_name("EU_E048N012T6")
e7tile = ...
The object can be printed to the console already revealing some attributes:
print(e7tile) # noqa: T201
Equi7Tile
---------
Name:
EU_E048N012T6
Shape:
(1200, 1200)
Projection:
+proj=aeqd +lat_0=53 +lon_0=24 +x_0=5837287.82 +y_0=2121415.696 +datum=WGS84 +units=m +no_defs +type=crs
Geotransformation parameters:
(4800000.0, 500.0, 0.0, 1800000.0, 0.0, -500.0)
Pixel origin:
ll
Covers land:
True
Properties#
Lets continue with inspecting the properties of this object. The first important property is the name of the tile instance, which is unique across all tiling systems of the Equi7Grid.
e7tile.name
'EU_E048N012T6'
“EU” is the tiling system/projection/continent identifier, “E048” is the X coordinate of the lower-left tile corner (divided by 10000 m, or in 100s of km), “N012” is analogously the Y coordinate of the lower-left tile corner, and “T6” is the tiling level/identifier. Since v1.0 some tiles in Europe and Asia might have negative coordinates, where the Y coordinate identifier then changes to “S”.
The Equi7Grid was build for efficiently representing high-resolution raster imagery, and it aims for reducing data redundancy as best as possible. Since geospatial raster imagery is usually shaped for a specific application over land or ocean, an Equi7Grid instance stores a land-sea mask to evaluate if a tile covers land or not. Thus, each Equi7 tile has a covers_land property, which can be used for filtering tiles.
e7tile.covers_land
True
The shape of the tile’s pixel array is defined by its width in pixels
e7tile.width
1200
and its height in pixels
e7tile.height
1200
Direct access on (height, width) is possible with .shape
e7tile.shape
(1200, 1200)
The same can be done by using actual world system coordinates in meters. The width is accessible through
e7tile.x_size
np.float64(600000.0)
and the height through
e7tile.y_size
np.float64(600000.0)
The sizes of each pixel can be easily retrieved via
e7tile.x_pixel_size
np.float64(500.0)
and
e7tile.y_pixel_size
np.float64(500.0)
As a note: The regular tiling systems of the Equi7Grid are quadratic, whereas its code basis, pytileproj’s RasterTile class, allows also rectangular tilings with different width and height settings.
A very important thing of the relationship between pixel and world system coordinates is the anchor point or pixel origin, i.e. to what point in the pixel the coordinate refers to. By default the GDAL definition is used, which states that the origin is in the upper-left corner of the upper-left pixel. But with an Equi7Tile, you can also choose between all other corner points and the pixel center.
The aforementioned properties and the different possibilities for the pixel origin are illustrated in the graphic below.
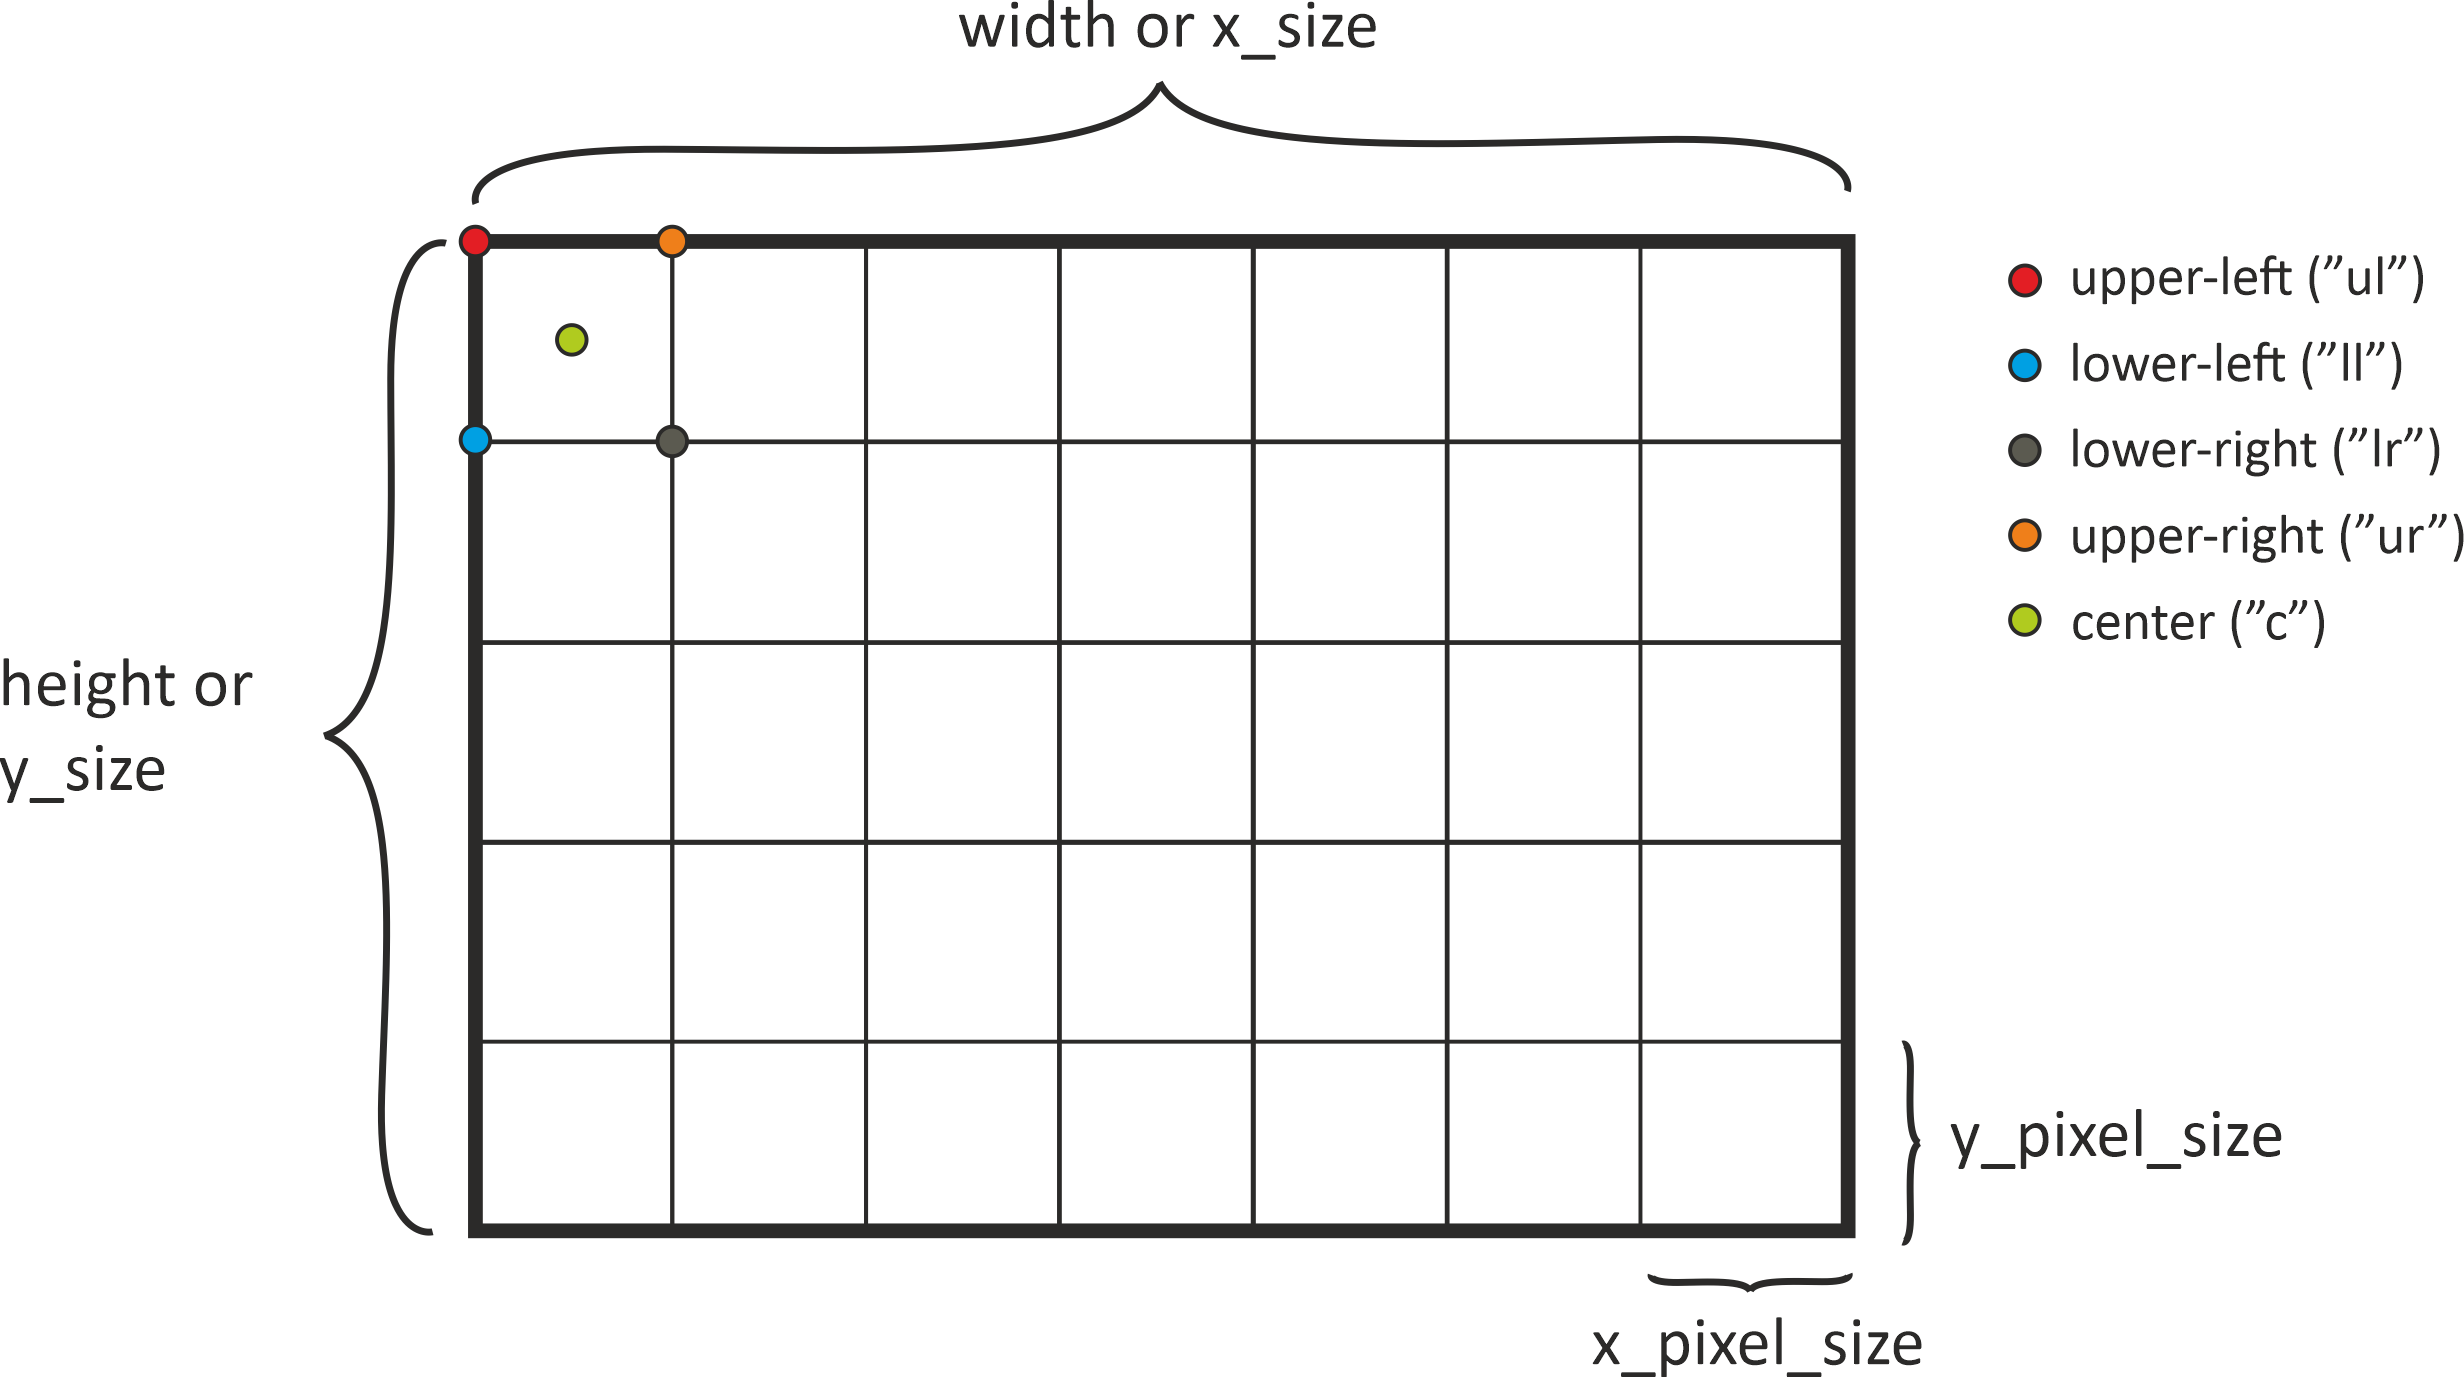
If you are interested in the corner points of the tile object, several properties help you to access the respective coordinates. For example, the lower-left corner, i.o.w. the first pixel in the last row, has the following coordinates:
e7tile.ll_x, e7tile.ll_y
(4800000.0, 1200000.0)
If you want to know the full coordinate extent (x_min, y_min, x_max, y_max), you can call
e7tile.coord_extent
(4800000.0, 1200000.0, 5399500.0, 1799500.0)
Please note that all these coordinates refer to the pixel origin, which has been chosen during class initialisation. If you are interested in the full extent of the tile (bold black line in the image before), you can use
e7tile.outer_boundary_extent
(4800000.0, 1200000.0, 5400000.0, 1800000.0)
The corner points of the outer boundary are available via
e7tile.outer_boundary_corners
((4800000.0, 1200000.0),
 (5400000.0, 1200000.0),
 (5400000.0, 1800000.0),
 (4800000.0, 1800000.0))
The full range of 1-D coordinates in a certain direction along the edges of a tile can be retrieved with
e7tile.x_coords
array([4800000., 4800500., 4801000., ..., 5398500., 5399000., 5399500.],
      shape=(1200,))
and
e7tile.y_coords
array([1799500., 1799000., 1798500., ..., 1201000., 1200500., 1200000.],
      shape=(1200,))
These coordinates only refer to the first row or first column. If you are interested in a meshgrid of every coordinate contained within the tile you can use:
e7tile.xy_coords
(array([[4800000., 4800000., 4800000., ..., 4800000., 4800000., 4800000.],
        [4800500., 4800500., 4800500., ..., 4800500., 4800500., 4800500.],
        [4801000., 4801000., 4801000., ..., 4801000., 4801000., 4801000.],
        ...,
        [5398500., 5398500., 5398500., ..., 5398500., 5398500., 5398500.],
        [5399000., 5399000., 5399000., ..., 5399000., 5399000., 5399000.],
        [5399500., 5399500., 5399500., ..., 5399500., 5399500., 5399500.]],
       shape=(1200, 1200)),
 array([[1799500., 1799000., 1798500., ..., 1201000., 1200500., 1200000.],
        [1799500., 1799000., 1798500., ..., 1201000., 1200500., 1200000.],
        [1799500., 1799000., 1798500., ..., 1201000., 1200500., 1200000.],
        ...,
        [1799500., 1799000., 1798500., ..., 1201000., 1200500., 1200000.],
        [1799500., 1799000., 1798500., ..., 1201000., 1200500., 1200000.],
        [1799500., 1799000., 1798500., ..., 1201000., 1200500., 1200000.]],
       shape=(1200, 1200)))
The boundary of the tile is also availabe on a higher-level, e.g. as a WKT string, OGR or shapely geometry.
e7tile.boundary_wkt
'POLYGON ((4800000 1200000, 5400000 1200000, 5400000 1800000, 4800000 1800000, 4800000 1200000))'
If you have an array/raster and you want to add geospatial context you require GDAL’s affine geotransformation parameters. These can be easily retrieved with
e7tile.geotrans
(4800000.0, 500.0, 0.0, 1800000.0, 0.0, -500.0)
Another important aspect in this regard is explicit projection information, which is accessible via
e7tile.pyproj_crs
<Projected CRS: EPSG:27704>
Name: WGS 84 / Equi7 Europe
Axis Info [cartesian]:
- E[east]: Easting (metre)
- N[north]: Northing (metre)
Area of Use:
- name: Europe including Russia west of the Ural Mountains.
- bounds: (-42.52, 29.24, 51.73, 83.67)
Coordinate Operation:
- name: Equi7 projection - Europe
- method: Azimuthal Equidistant
Datum: World Geodetic System 1984 ensemble
- Ellipsoid: WGS 84
- Prime Meridian: Greenwich
which returns a pyproj.CRS instance. These two objects offer the best interface with other geospatial libraries, e.g., rasterio.
Not all properties have been discussed here. Please take look at equi7grid’s API documentation and pytileproj’s API documentation to explore the full range of offered functionality.
Plotting#
A very nice feature of a tile is that you can plot it on a map. Several keywords can help you to beautify your plot. First, we can simply try to plot the tile we have retrieved before.
import matplotlib.pyplot as plt

plt.figure(figsize=(15, 15))
_ = e7tile.plot()
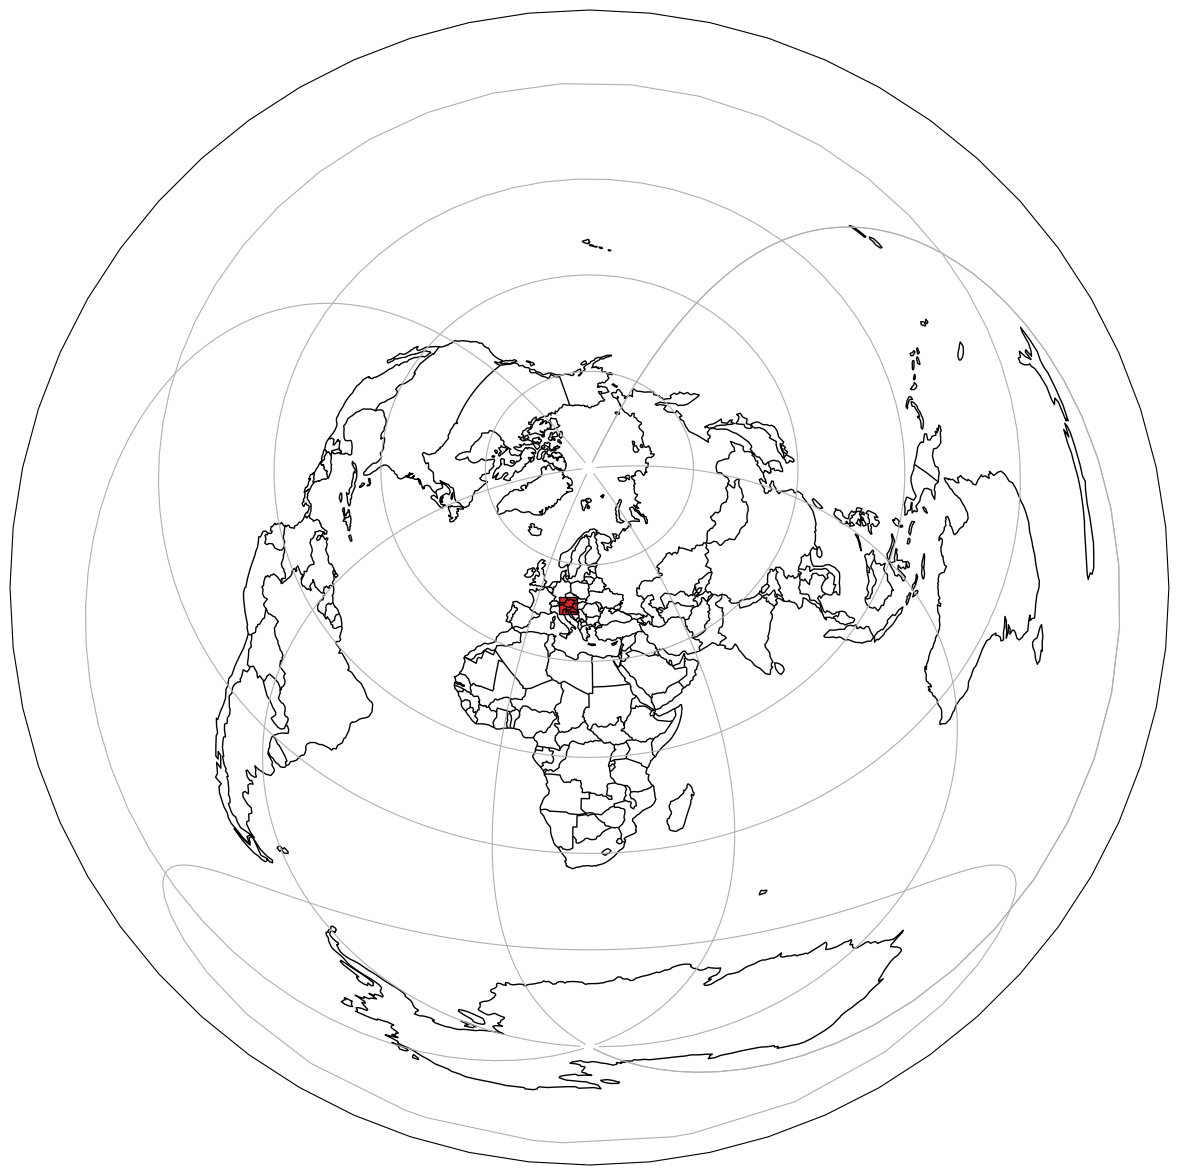
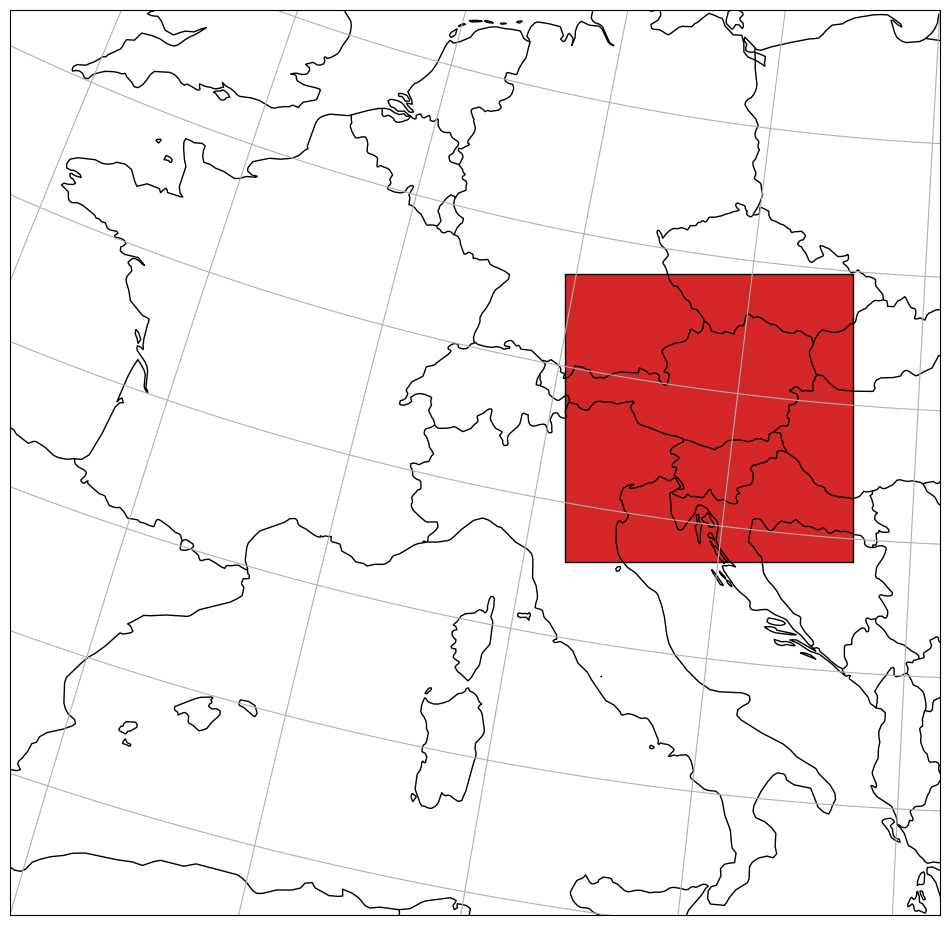
Since the full extent of the projection is chosen by default, we can try limit the extent with:
import pyproj

plt.figure(figsize=(12, 12))
_ = e7tile.plot(extent=(0, 35, 20, 55), extent_proj=pyproj.CRS.from_epsg(4326))
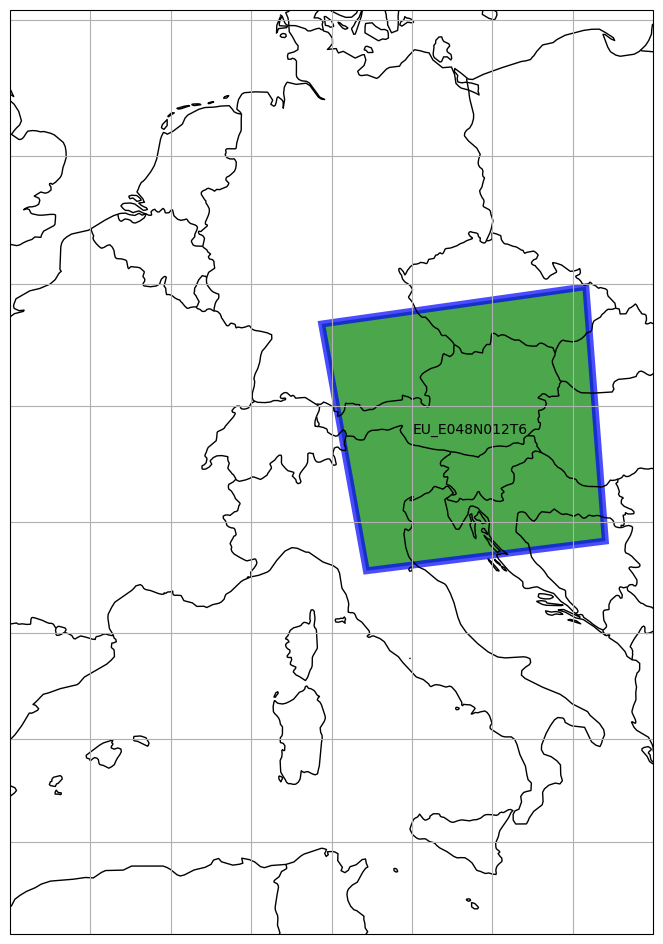
The plot function also allows to change the projection. We can try to define a new one, e.g. a Pseudo-Mercator projection, and use it for our new map.
import pyproj

plt.figure(figsize=(12, 12))
_ = e7tile.plot(
    label_tile=True,
    facecolor="green",
    edgecolor="blue",
    edgewidth=5,
    alpha=0.7,
    proj=3857,
    extent=(0, 35, 20, 55),
    extent_proj=pyproj.CRS.from_epsg(4326),
)
Topological operations#
When using the Equi7Tile object for subsequent processing, it might be helpful to check if geometries have a certain topological relation with the tile or not. In the next example we define several simple polygon geometries using pytileproj’s geometry objects (more details on these objects can be found here):
import shapely
from pytileproj import ProjGeom

inner_poly = shapely.Polygon(
    [(5200000, 1300000), (5400000, 1300000), (5400000, 1600000), (5200000, 1600000)]
)
inner_geom = ProjGeom(geom=inner_poly, crs=e7tile.pyproj_crs)

outer_poly = shapely.Polygon(
    [(6200000, 2300000), (6400000, 2300000), (6400000, 2600000), (6200000, 2600000)]
)
outer_geom = ProjGeom(geom=outer_poly, crs=e7tile.pyproj_crs)

touches_poly = shapely.Polygon(
    [(5400000, 1300000), (6400000, 1300000), (6400000, 1600000), (5400000, 1600000)]
)
touches_geom = ProjGeom(geom=touches_poly, crs=e7tile.pyproj_crs)

contains_poly = shapely.Polygon(
    [(4500000, 1100000), (6400000, 1100000), (6400000, 1900000), (4500000, 1900000)]
)
contains_geom = ProjGeom(geom=contains_poly, crs=e7tile.pyproj_crs)

overlaps_poly = shapely.Polygon(
    [(5200000, 1300000), (6400000, 1300000), (6400000, 1600000), (5200000, 1600000)]
)
overlaps_geom = ProjGeom(geom=overlaps_poly, crs=e7tile.pyproj_crs)
An Equi7 tile has four topological operators returning a boolean depending on if the relation is given or not: intersects, overlaps, within, and touches. Using the tile object and the polygons, we can evaluate all possible relations:
(
    e7tile.intersects(inner_geom),
    e7tile.intersects(touches_geom),
    e7tile.intersects(outer_geom),
    e7tile.intersects(contains_geom),
    e7tile.intersects(overlaps_geom),
)
(True, True, False, True, True)
(
    e7tile.overlaps(inner_geom),
    e7tile.overlaps(touches_geom),
    e7tile.overlaps(outer_geom),
    e7tile.overlaps(contains_geom),
    e7tile.overlaps(overlaps_geom),
)
(False, False, False, False, True)
(
    e7tile.within(inner_geom),
    e7tile.within(touches_geom),
    e7tile.within(outer_geom),
    e7tile.within(contains_geom),
    e7tile.within(overlaps_geom),
)
(False, False, False, True, False)
(
    e7tile.touches(inner_geom),
    e7tile.touches(touches_geom),
    e7tile.touches(outer_geom),
    e7tile.touches(contains_geom),
    e7tile.touches(overlaps_geom),
)
(False, True, False, False, False)
Coordinate Conversions#
An Equi7 tile also provides an interface for pixel to coordinate (rc2xy) and coordinate to pixel (xy2rc) conversions.
import numpy as np

rows, cols = np.meshgrid(np.arange(25, 30), np.arange(0, 25))
x_coords, y_coords = e7tile.rc2xy(rows.flatten(), cols.flatten())
x_coords, y_coords
(array([4800000., 4800000., 4800000., 4800000., 4800000., 4800500.,
        4800500., 4800500., 4800500., 4800500., 4801000., 4801000.,
        4801000., 4801000., 4801000., 4801500., 4801500., 4801500.,
        4801500., 4801500., 4802000., 4802000., 4802000., 4802000.,
        4802000., 4802500., 4802500., 4802500., 4802500., 4802500.,
        4803000., 4803000., 4803000., 4803000., 4803000., 4803500.,
        4803500., 4803500., 4803500., 4803500., 4804000., 4804000.,
        4804000., 4804000., 4804000., 4804500., 4804500., 4804500.,
        4804500., 4804500., 4805000., 4805000., 4805000., 4805000.,
        4805000., 4805500., 4805500., 4805500., 4805500., 4805500.,
        4806000., 4806000., 4806000., 4806000., 4806000., 4806500.,
        4806500., 4806500., 4806500., 4806500., 4807000., 4807000.,
        4807000., 4807000., 4807000., 4807500., 4807500., 4807500.,
        4807500., 4807500., 4808000., 4808000., 4808000., 4808000.,
        4808000., 4808500., 4808500., 4808500., 4808500., 4808500.,
        4809000., 4809000., 4809000., 4809000., 4809000., 4809500.,
        4809500., 4809500., 4809500., 4809500., 4810000., 4810000.,
        4810000., 4810000., 4810000., 4810500., 4810500., 4810500.,
        4810500., 4810500., 4811000., 4811000., 4811000., 4811000.,
        4811000., 4811500., 4811500., 4811500., 4811500., 4811500.,
        4812000., 4812000., 4812000., 4812000., 4812000.]),
 array([1787000., 1786500., 1786000., 1785500., 1785000., 1787000.,
        1786500., 1786000., 1785500., 1785000., 1787000., 1786500.,
        1786000., 1785500., 1785000., 1787000., 1786500., 1786000.,
        1785500., 1785000., 1787000., 1786500., 1786000., 1785500.,
        1785000., 1787000., 1786500., 1786000., 1785500., 1785000.,
        1787000., 1786500., 1786000., 1785500., 1785000., 1787000.,
        1786500., 1786000., 1785500., 1785000., 1787000., 1786500.,
        1786000., 1785500., 1785000., 1787000., 1786500., 1786000.,
        1785500., 1785000., 1787000., 1786500., 1786000., 1785500.,
        1785000., 1787000., 1786500., 1786000., 1785500., 1785000.,
        1787000., 1786500., 1786000., 1785500., 1785000.]))
rows, cols = e7tile.xy2rc(x_coords, y_coords)
rows, cols
(array([26, 27, 28, 29, 30, 26, 27, 28, 29, 30, 26, 27, 28, 29, 30, 26, 27,
        28, 29, 30, 26, 27, 28, 29, 30, 26, 27, 28, 29, 30, 26, 27, 28, 29,
        30, 26, 27, 28, 29, 30, 26, 27, 28, 29, 30, 26, 27, 28, 29, 30, 26,
        27, 28, 29, 30, 26, 27, 28, 29, 30, 26, 27, 28, 29, 30, 26, 27, 28,
        29, 30, 26, 27, 28, 29, 30, 26, 27, 28, 29, 30, 26, 27, 28, 29, 30,
        26, 27, 28, 29, 30, 26, 27, 28, 29, 30, 26, 27, 28, 29, 30, 26, 27,
        28, 29, 30, 26, 27, 28, 29, 30, 26, 27, 28, 29, 30, 26, 27, 28, 29,
        30, 26, 27, 28, 29, 30]),
 array([ 0,  0,  0,  0,  0,  1,  1,  1,  1,  1,  2,  2,  2,  2,  2,  3,  3,
         3,  3,  3,  4,  4,  4,  4,  4,  5,  5,  5,  5,  5,  6,  6,  6,  6,
         6,  7,  7,  7,  7,  7,  8,  8,  8,  8,  8,  9,  9,  9,  9,  9, 10,
        10, 10, 10, 10, 11, 11, 11, 11, 11, 12, 12, 12, 12, 12, 13, 13, 13,
        13, 13, 14, 14, 14, 14, 14, 15, 15, 15, 15, 15, 16, 16, 16, 16, 16,
        17, 17, 17, 17, 17, 18, 18, 18, 18, 18, 19, 19, 19, 19, 19, 20, 20,
        20, 20, 20, 21, 21, 21, 21, 21, 22, 22, 22, 22, 22, 23, 23, 23, 23,
        23, 24, 24, 24, 24, 24]))
Magic Methods#
For some of the aforementioned functions a set of magic methods are available to enable a Pythonic usage of an Equi7 tile. This involves for instance the within check, which is internally called when using Pythons in.
inner_geom in e7tile, outer_geom in e7tile
(True, False)
The str method returns the WKT representation of the boundary of the tile.
str(e7tile)
'Equi7Tile \n--------- \nName: \nEU_E048N012T6 \nShape: \n(1200, 1200)\nProjection: \n+proj=aeqd +lat_0=53 +lon_0=24 +x_0=5837287.82 +y_0=2121415.696 +datum=WGS84 +units=m +no_defs +type=crs\nGeotransformation parameters: \n(4800000.0, 500.0, 0.0, 1800000.0, 0.0, -500.0)\nPixel origin: \nll\nCovers land: \nTrue'