from typing import Any

import matplotlib.colors as mcolors
import matplotlib.pyplot as plt
import xarray as xr

from envrs.download_path import make_url18.1 A machine Learning Approach
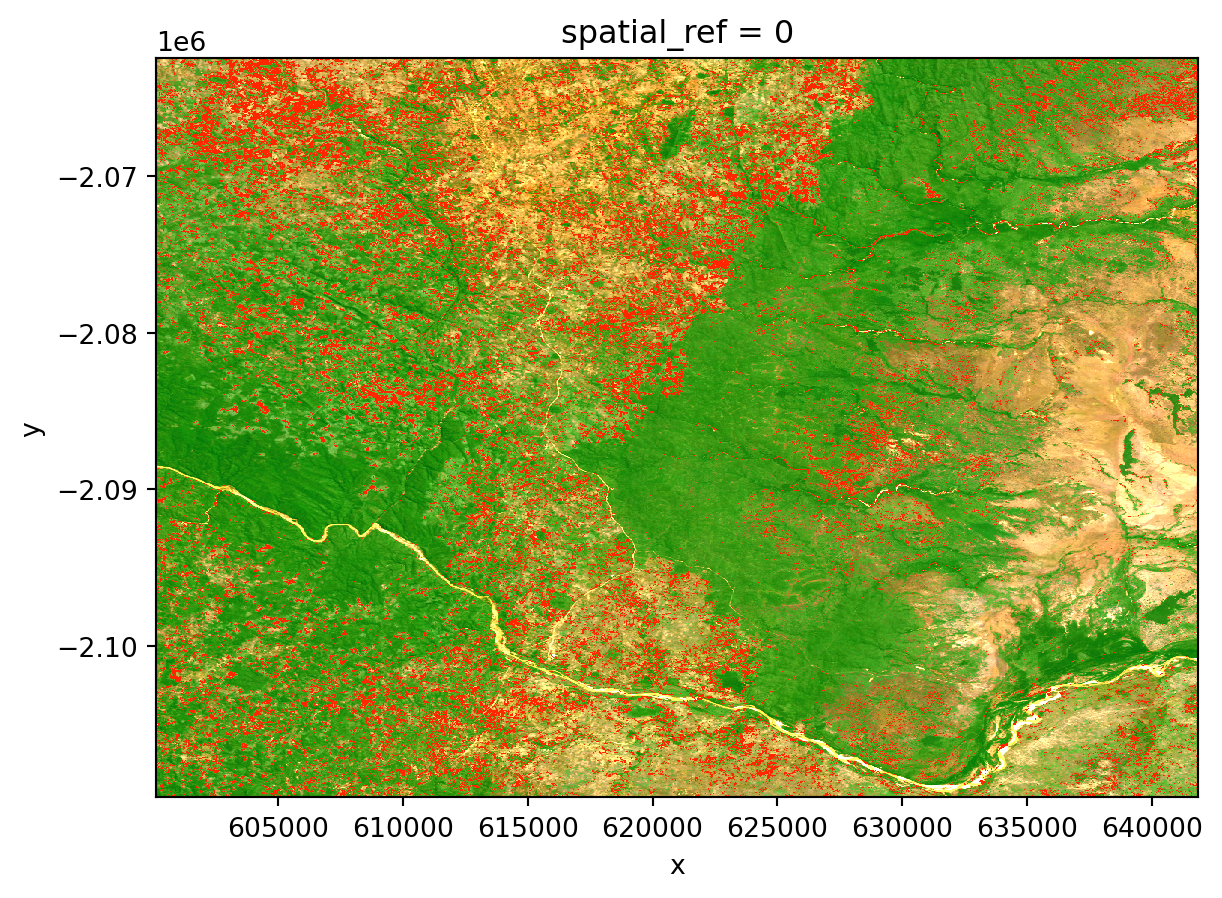
In this notebook, we will focus on the classification of deforestation in Mozambique. We will be useing a Machine Learning approach to classify the forest cover (as explained in the previous notebook) and will be covering the deforestation here, where we will specifically have a look at the changes in forest cover over time.
It is assumed here that you are already familiar with the previous notebook, since we will be useing the forest cover classification as a basis for the deforestation analysis.
common_url_params: dict[str, Any] = {
    "is_zip": True,
}

url_before = make_url(
    "forest_classification_2018.zarr.zip",
    **common_url_params,
)
url_after = make_url(
    "forest_classification_2024.zarr.zip",
    **common_url_params,
)
url_dc = make_url(
    "HLS_T36KXE_2024_b30_v2.zarr.zip",
    **common_url_params,
)
https://git.geo.tuwien.ac.at/api/v4/projects/1266/repository/files/forest_classification_2018.zarr.zip/raw?ref=main&lfs=true
https://git.geo.tuwien.ac.at/api/v4/projects/1266/repository/files/forest_classification_2024.zarr.zip/raw?ref=main&lfs=true
https://git.geo.tuwien.ac.at/api/v4/projects/1266/repository/files/HLS_T36KXE_2024_b30_v2.zarr.zip/raw?ref=main&lfs=truecommon_params: dict[str, Any] = {
"engine": "zarr",
"consolidated": False,
}
forest_before = xr.open_dataarray(url_before, **common_params)
forest_after = xr.open_dataarray(url_after, **common_params)
img = xr.open_dataset(url_dc, **common_params)bit_zero = 1 << 0 # 0b01
bit_one = 1 << 1 # 0b10
forest_label_value = 1
# fmt: off
deforestation = (
(forest_before == forest_label_value) * bit_zero
+ (forest_after == forest_label_value) * bit_one
)
# fmt: on
deforestation_value = int("0b01", 2) # before=1 and after=0 -> was forest but not now
deforestation = deforestation.where(deforestation == deforestation_value)cmap_red = mcolors.ListedColormap(["#FF2600"])
cmap_green = mcolors.ListedColormap(["#00FF20"])
fig, ax = plt.subplots()
img[["Red", "Green", "Blue"]].sel(quantile=0.5).to_dataarray().plot.imshow(
robust=True,
ax=ax,
)
deforestation.squeeze().plot.imshow(ax=ax, alpha=1, cmap=cmap_red, add_colorbar=False)
forest_after.where(forest_after == forest_label_value).squeeze().plot.imshow(
ax=ax,
alpha=0.3,
cmap=cmap_green,
add_colorbar=False,
)
plt.show()